References

Deployments where the stakes are real.

Projects delivered for institutions and operators: the process, the scale and the result, from source to deliverable.

High-voltage line in its forest corridor, seen from above

Projects, from source to deliverable.

Six projects delivered and one programme under way, driven by the same capability: combining heterogeneous data to produce a reliable reading of the territory.

Telecommunications tower overlooking a city
10,000+towers in the register11,700 kmof optical fibre

Telecommunications

Regulatory authority

Mapping telecommunications infrastructure

Consolidate the sites declared by several operators into a reliable register.

A unified register of sites, mapping poorly covered areas and sites suitable for sharing.

Sources

Operator declarations, Optical and radar satellite imagery, Population data

Fusion

Cross-checking operator declarations against imagery and population data.

Analysis

Deduplication, coverage modelling, ranking of poorly covered areas and sites suitable for sharing.

Deliverable

Unified site register and map of possible infrastructure sharing.
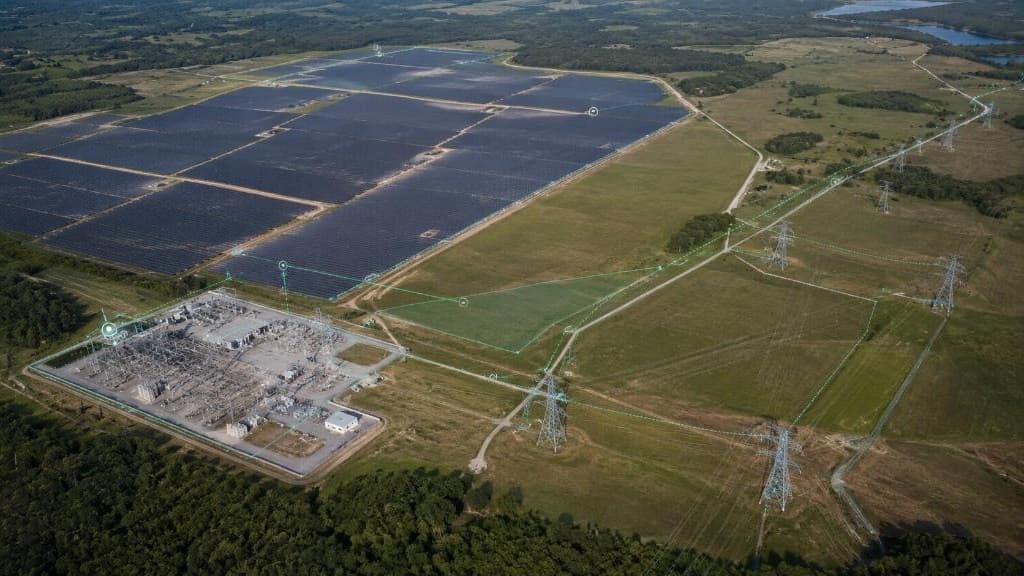
Electrical substation and solar farm seen from the sky

Energy

Electricity operator

Georeferenced register of assets and consumption points

Know precisely where assets and customers are in order to manage the network.

A georeferenced, reliable register, ready to support network management.

Sources

Operator administrative databases, Optical and radar satellite imagery, Field surveys

Fusion

Aligning the operator’s databases with satellite imagery.

Analysis

Matching the operator’s databases with imagery to georeference the register and make it reliable.

Deliverable

Georeferenced, reliable register of assets and consumption points.

High-voltage line in its forest corridor

Energy

High-voltage transmission network

Audit of a high-voltage transmission network

Locate the spans where vegetation threatens network safety.

A ranking of at-risk spans, guiding vegetation clearance across several thousand km.

Sources

LiDAR survey, Optical and radar satellite imagery, Field surveys

Fusion

Aligning the LiDAR survey and satellite imagery with the line routes.

Analysis

3D measurement of conductor-to-vegetation clearances, regrowth tracking between two campaigns, intervention ranking.

Deliverable

Ranked intervention plan across several thousand km of lines.

Railway crossing a forest
5,000+ kmof lines monitored

Infrastructure

Infrastructure operator

Continuous monitoring of critical infrastructure

Detect threats early on a network too extensive to be inspected physically.

Per-asset alerts, triggered as soon as a significant change is detected.

Sources

Optical and radar satellite imagery, Client administrative databases, Field surveys

Fusion

Temporal alignment of optical and radar series, mapped to each asset.

Analysis

Change detection from optical and radar imagery (usable under cloud), risk scoring and per-asset alerts.

Deliverable

Per-asset alerts and time-series monitoring across an extensive network.

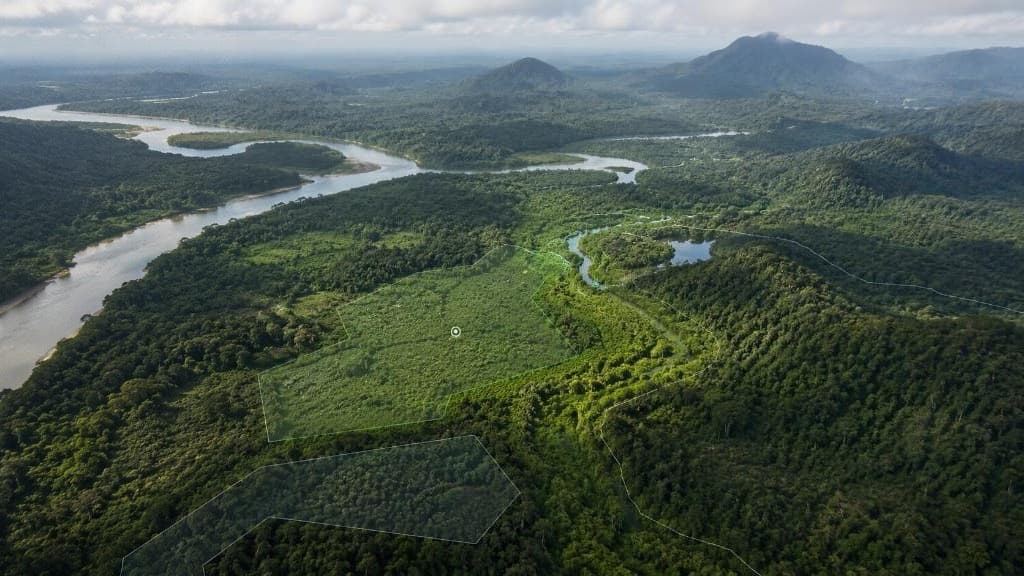
Forest area seen from the sky

Environment

Natural-area management authority

Environmental mapping of a concession

Monitor cover and pressures across a large concession.

Continuous monitoring of cover and pressure fronts across the concession.

Sources

Optical and radar satellite imagery, Hyperspectral, Territorial layers

Fusion

Harmonising multi-sensor series across the concession perimeter.

Analysis

Multi-sensor time series, distinguishing degradation from deforestation, identifying pressure fronts.

Deliverable

Continuous monitoring of cover and pressure fronts across the concession.

LiDAR relief model of an erosion area above a river

Environment

Catchment manager

Predictive erosion model

Anticipate gully progression to prioritise prevention works.

An erosion susceptibility map that prioritises prevention works.

Sources

Optical and radar satellite imagery, DEM and terrain, Weather and climate

Fusion

Combining terrain, soils and climate series.

Analysis

Machine-learning susceptibility model combining terrain, soils, rainfall and land use.

Deliverable

Erosion susceptibility map prioritising prevention works.

Electricity pylons and power lines

Energy · In progress

Electricity operator

Predictive maintenance programme for an electricity network

Move from maintenance after failure to maintenance planned according to risk.

A risk score per asset that structures a planned maintenance schedule.

Sources

Incident history, Asset condition, Satellite imagery (vegetation pressure)

Fusion

Cross-checking incident history, asset condition and vegetation pressure.

Analysis

Per-asset risk score combining incident history, asset condition and vegetation pressure.

Deliverable

Per-asset risk score and planned maintenance schedule.

Source fusion comes before analysis.

Anemone aligns LiDAR, optical and radar satellite imagery, field surveys and client databases in space and time. This is the step that reveals signals no single source can show.

Private cloudHosting on dedicated, isolated infrastructure, under your control.
On-premiseDeployed at your site, on your servers, with no external dependency.
Sovereign cloudHosting on a certified sovereign cloud, suited to regulated environments.
Discuss your deployment →

Talk to an Anemone expert

Let’s discuss your operational challenges and the deployment model that best fits your organisation.

Request a demonstration

Cookie settings

Necessary

Your chosen language, your cookie choice and protection of forms against bots.

Always active

Audience measurement

Anonymous visit statistics (Vercel Web Analytics), with no advertising cookies and no cross-site tracking.

Cookie policy